- H-85A, 2nd Floor, South Extension I, New Delhi, Delhi 110049
- Home
- COURSES
- DSTI Delhi
- Laxmi Nagar DSTI
- Online + Classroom Data Science in Laxmi Nagar
- Job-Oriented Data Science Training in Laxmi Nagar
- Weekend Data Science Course in Laxmi Nagar
- Advanced Excel and Power BI in Laxmi Nagar
- Data Analysis Training in Laxmi Nagar
- Data Visualization Course in Laxmi Nagar
- Artificial Intelligence Course in Laxmi Nagar
- Data Analytics Course in Laxmi Nagar
- Data Science Course in Laxmi Nagar
- Python for Data Science in Laxmi Nagar
- Power BI Training in Laxmi Nagar
- Machine Learning Course in Laxmi Nagar
- Contact Us
- About Us
- BLOG
Data Visualization Course in Laxmi Nagar

Introduction
Master Data Storytelling with Industry Tools – Live Projects | Flexible Batches | Certification
At DSTI, our Data Visualization Course in Laxmi Nagar is designed for aspiring data analysts, marketers, business professionals, and students who want to convert raw data into meaningful insights. Through a hands-on 6–8 week program, you’ll master top visualization tools, learn the art of crafting dashboards, and gain storytelling skills to influence real-world business decisions.
Whether you’re a beginner or want to sharpen your analytics toolkit, this course empowers you with practical knowledge that employers demand.
Data Visualization Course Modules
● What is data visualization and why it matters
● Different types of charts and graphs
● Data storytelling and communication basics
● Role of data visualization in business decisions
● Types of data: categorical, numerical, time series
● Organizing and preparing data for visuals
● Data cleaning basics: removing errors and inconsistencies
● Importance of context and labeling
● Creating bar, line, pie, combo, and scatter charts
● Working with pivot tables and slicers
● Building dashboards with interactivity
● Formatting and design tips for reports
● Introduction to Tableau interface
● Connecting to different data sources
● Creating worksheets, dashboards, and stories
● Filters, actions, parameters, and dynamic visuals
● Power BI Desktop overview
● Importing and transforming data
● Creating visuals and custom dashboards
● Publishing reports to Power BI service
● Plotting with Matplotlib: line, bar, histograms
● Using Seaborn for statistical charts
● Customizing themes, colors, labels, and layouts
● Combining multiple visuals into a single plot
● Principles of interactivity in visuals
● Using Tableau/Power BI for interactive reports
● Filtering, tooltips, and drill-down features
● Making dashboards mobile- and web-friendly
● Color theory and chart aesthetics
● Avoiding clutter and misrepresentation
● Layout, spacing, and storytelling flow
● Examples of good and bad visualizations
● Real-time project on sales, marketing, finance, or social data
● Complete dashboard creation with storytelling elements
● Final review and feedback from trainer
● Portfolio-ready project presentation
● Resume preparation for visualization roles
● LinkedIn branding and personal portfolio setup
● Mock interviews and reporting case studies
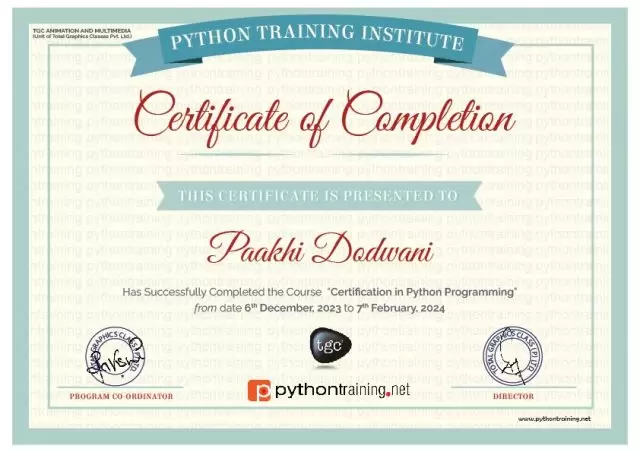
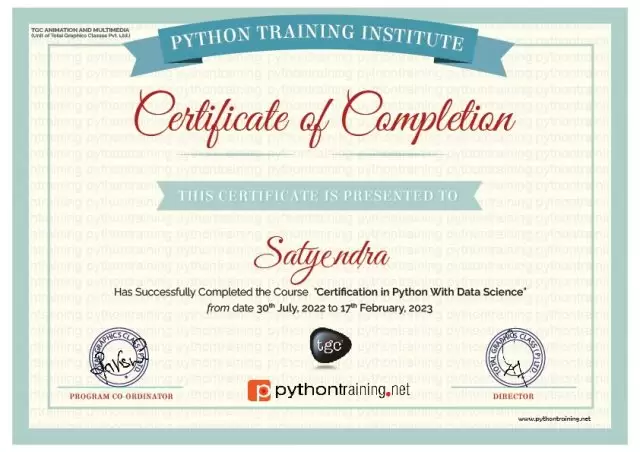
● Job assistance and certification from Python Training Institute
We're Here To Provide 24X7Support
Trusted for Python, Data Science , AI & ML
Thousands trust us for Advanced training in Python, Data Science, Machine Learning, and AI. We deliver proven outcomes through hands-on experience.
Train with the best
Why Choose Us
Real LIfe Learning
We focus on teaching skills that companies look for—reporting, dashboarding, and storytelling using the top visualization tools in the market. You’ll be job-ready by the end of the course.
Hands-On Project Work
Every tool and concept is practiced with real business data. You’ll work on multiple projects like sales analysis, financial reporting, marketing dashboards, and more.
Expert Trainers
Learn from professionals who design reports and dashboards for real clients. Our trainers bring practical tips and feedback to improve your skills and design sense.
Updated Tools & Skills
We train you on Excel, Tableau, Power BI, Matplotlib, and Seaborn—giving you a wide scope of job opportunities across tools and platforms. In demand tools.
Personalized Mentorship
You’ll graduate with a ready-to-showcase portfolio and a certificate from Python Training Institute to add value to your resume and online profile.
Flexible Learning Options
Weekday and weekend batches are available. You can also access backup classes and session recordings in case of a missed session.
100% Placement Support
From preparing your resume to sending you job leads and arranging interviews—we support you every step of the way until you get placed.
Portfolio & Certification
You’ll graduate with a ready-to-showcase portfolio and a certificate from Python Training Institute to add value to your resume and online profile.
Top Placements


Our Process
One-on-One Counseling
Before you enroll, we understand your background, career goals, and suggest the most suitable batch, pace, and tool focus for your learning style.
Free Demo Class
Join a free trial session and see our training in action. Get familiar with the teaching method, course content, and structure before committing.
Seamless Onboarding
Once enrolled, you get full access to resources, dashboards, tools, and study material. Orientation helps you get started without delay.
Learn by Doing
We follow a “learn and apply” approach. You’ll build real dashboards and reports using live datasets, just like it’s done in actual companies.
Capstone Dashboard Project
Each topic comes with guided practice and assignments to strengthen your learning. Your trainer will review and give feedback regularly.
Doubt Support
Stuck somewhere? Book a one-on-one session with your trainer or attend weekly doubt-clearing classes to stay on track and confident.
Interview Preparation
Resume writing, mock interviews, project-based interview tasks, and communication tips are part of your job-readiness plan.
Placement Support & Certification
You receive an industry-recognized certificate along with job assistance. We connect you with openings, referrals, and company-specific guidance.
Here's what our learnerssay!
GET CERTIFICATE


JOB PLACEMENT
How Will You Secure Your First Job?

Companies want people who can create clean, professional reports. You’ll be skilled in Tableau, Power BI, Excel, and Python plotting libraries used in real-world jobs.
You’ll complete at least 4–5 projects that can be shared with employers—covering different domains like sales, HR, finance, and social media.
Our team will help you create a strong resume tailored for reporting, MIS, data analyst, or BI roles—along with a polished LinkedIn profile.
You’ll participate in mock sessions covering both technical and scenario-based questions, improving your confidence and communication.
Our placement team shares new job openings regularly. We also connect you to companies hiring for junior analysts, dashboard developers, and visualization experts.
Even after the course ends, we continue to support you with guidance, new project ideas, portfolio reviews, and job alerts.
Honest Reviews, RealInsights
Posted onTrustindex verifies that the original source of the review is Google. I had an amazing experience with the Data Science Classes at DSTI. The course is well-structured, and the trainers are experts in their field. The institute also provides access to industry-relevant tools and technologies. If you're looking for a Data Science Course in Delhi, DSTI should be your first choice.Posted onTrustindex verifies that the original source of the review is Google. The Data Science Course in Delhi offered by DSTI is truly a game-changer. The curriculum is well-designed, and the focus on practical learning is impressive. I particularly enjoyed the capstone project, which gave me hands-on experience. DSTI has helped me build a strong foundation in data science.Posted onTrustindex verifies that the original source of the review is Google. I attended the Data Science Classes at DSTI, and it was a fantastic experience. The trainers are highly skilled and make complex topics easy to understand. The institute also provides excellent study materials and resources. If you're looking for quality Data Science Training in Delhi, DSTI is the right choice.Posted onTrustindex verifies that the original source of the review is Google. DSTI is one of the best institutes for Data Science Training in Delhi. The course is designed to cater to both beginners and experienced professionals. The practical assignments and real-world case studies helped me understand the concepts better. I’m now confident in my data science skills, all thanks to DSTI!Posted onTrustindex verifies that the original source of the review is Google. I enrolled in the Data Science Training program at DSTI, and it exceeded my expectations. The course material is up-to-date, and the instructors are industry experts. The placement assistance provided by DSTI is also commendable. I landed a job as a data analyst right after completing the course. Thank you, DSTI!Posted onTrustindex verifies that the original source of the review is Google. DSTI offers one of the best Data Science Classes in Delhi. The course is well-structured, and the hands-on projects helped me gain practical experience. The faculty is supportive, and the learning environment is great. If you're serious about data science, DSTI is the place to be!Posted onTrustindex verifies that the original source of the review is Google. I recently completed the Data Science Training in Delhi at DSTI, and I must say it was an incredible learning experience. The course content was comprehensive, covering everything from Python programming to advanced machine learning techniques. The instructors were knowledgeable and always willing to help. Highly recommend DSTI for anyone looking to start a career in data science!Posted onTrustindex verifies that the original source of the review is Google. DSTI is a trusted name for data science courses in Delhi. The trainers are patient and provide personalized attention to every student. he placement support and career guidance are excellent.Posted onTrustindex verifies that the original source of the review is Google. I highly recommend DSTI for data science courses in Delhi. The institute has a great learning environment and experienced faculty. Muskan mam and tanzeel sir great teacher.Posted onTrustindex verifies that the original source of the review is Google. I had a great experience learning data science in South Delhi at DSTI. The course is well-designed, and the trainers are industry experts. The course starts from the basics and gradually moves to advanced topics.
Data Science TrainingInstitutePlacementSupport
Perks
Perks Python Training Institute Placement support
- Learn tools and methods used by real analysts and BI professionals
- Flexible Learning Options with both Offline and Online Sessions
- Instructors with hands-on experience at leading analytics firms
- Visualize real datasets in marketing, sales, healthcare, and more
- Dedicated Academic and Admin Support for a smooth learning experience
- Placement Manager Assistance for job search and application guidance
- Real-world Projects and Case Studies to enhance practical learning
- Hackathons and Competitions to build portfolio and gain recognition
- Choose weekend or weekday batches, online or classroom format
- Resume building, interview prep, and job referrals for top performers
We're Here To Provide 24X7Support
Say Hello!
Feel free to reach out to us for course details, timings, and enrollment information.
24/7 contact support
Frequently Asked Questions(FAQ)
This course is ideal for students, analysts, marketers, business professionals, and aspiring data scientists who want to learn how to represent data visually and communicate insights effectively. Whether you’re a beginner or upskilling, this course has something for everyone.
No. We teach Excel, Tableau, and Power BI without coding. Python for plotting is introduced from scratch for those who want it.
Both options are available. You can join online from anywhere or attend offline classes at our Delhi center.
Yes. You will receive a certificate of completion from Python Training Institute after finishing all modules and your final project.
You’ll learn Excel (advanced), Tableau, Power BI, Matplotlib, and Seaborn—used for data storytelling and professional reporting.
The course runs for 6–8 weeks. Fees vary based on the batch mode — contact us for the latest details and discounts.
You can apply for roles such as Data Visualization Specialist, MIS Executive, Reporting Analyst, Tableau Developer, or Power BI Analyst.
Definitely. Our curriculum is reviewed regularly by industry experts to include the latest trends, tools, and case studies so you stay competitive in the job market.
After completing this course, you can apply for roles like Data Visualization Specialist, BI Analyst, Dashboard Developer, Reporting Analyst, or Data Analyst in various industries including tech, finance, healthcare, and e-commerce.


